7. Claim Reserving
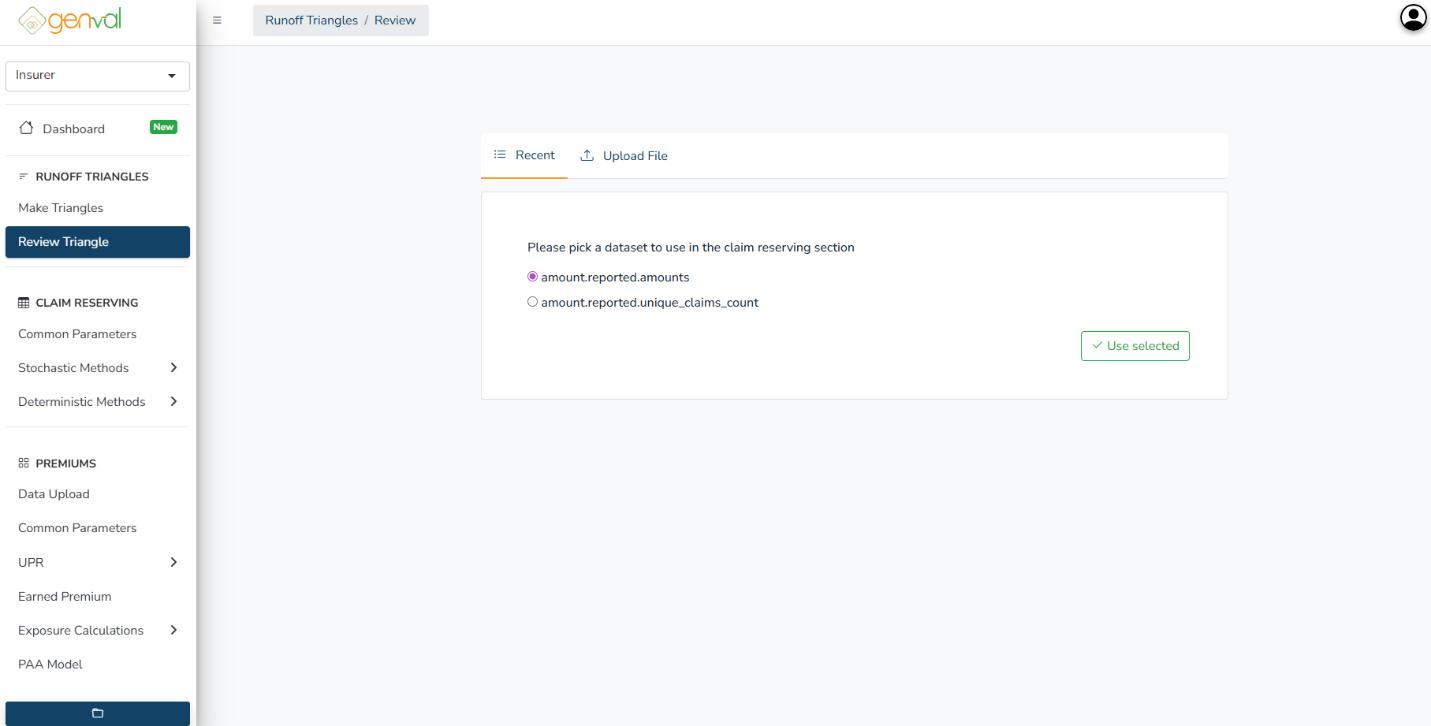
After generating or uploading run-off triangles, proceed to select the triangle to use. Click the Use Selected button.

You will be directed to preview the chosen file(triangle). Click Proceed to reserving section on the preview page.
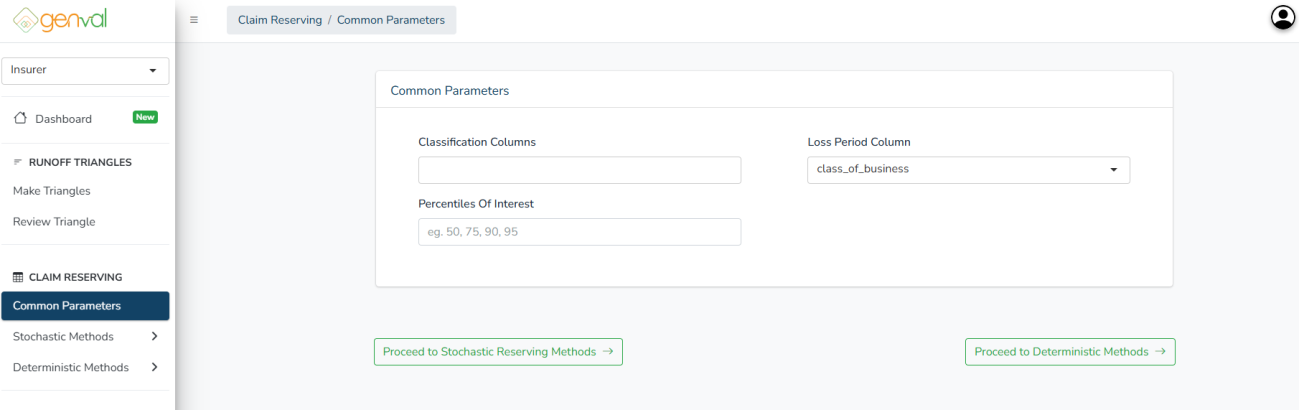
You will be needed to enter the common parameters that are used for both the stochastic and deterministic methods.
Classification Columns – Specifies the data fields used to group claims, such as class of business, enabling separate analyses for each category.
Loss Period Column – Identifies the time-based column used to define the loss development periods for reserving.
Percentiles of Interest – Allows entry of percentile values (e.g., 50, 75, 90, 95) to generate reserve estimates at different confidence levels.
Click the Proceed to Stochastic Reserving Methods to utilize stochastic models that estimate reserves using probability distributions.
Click the Proceed to Deterministic Methods to navigate to deterministic models that calculate reserves using fixed, formula-based methods.
Stochastic Methods
You will be directed to the BootChainLadder, the first on the sidebar. You can select any of the methods that you want to use (BootChainLadder, MackChainLadder or Generalized Linear Mode).
a) BootChainLadder:
You’ll be prompted to input your preferred process distribution, the statistical distribution assumed for claim development.
- Gamma – Suitable for continuous claim amounts with positive skewness.
- Over-Dispersed Poisson – Used for modeling count-based data or amounts with higher variance relative to the mean.

Click the Run BootChainLadder button to apply the method:
b) MackChainLadder:
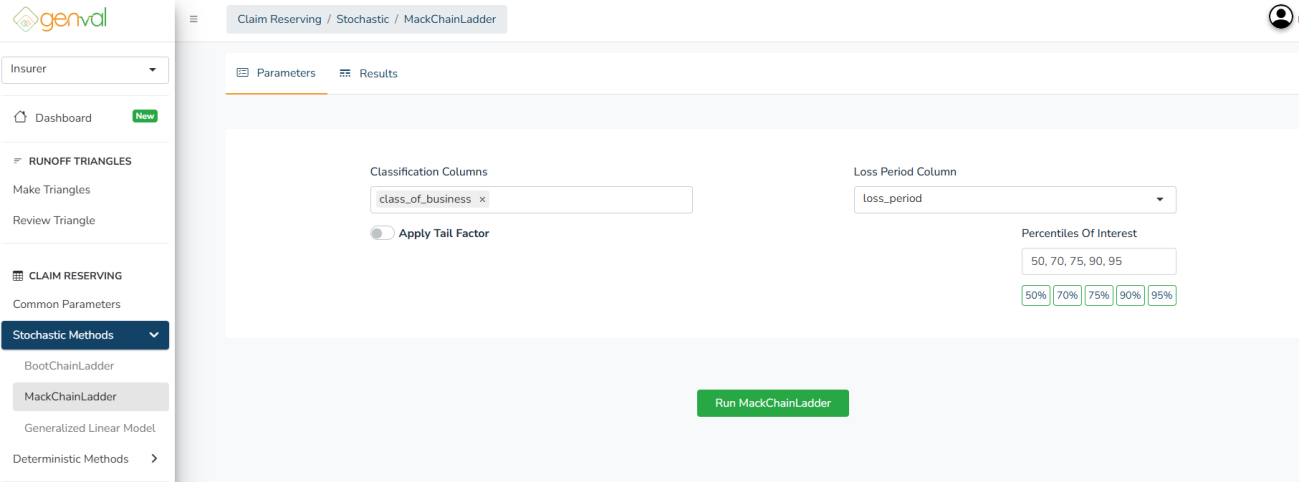
Here, there’s a parameter checkbox labeled Apply Tail Factor - When enabled, GENVAL prompts for a tail factor value for extrapolating reserves beyond the observed development horizon. The Mack Chain Ladder assumes a stable tail, but enabling this adjusts for long-tail lines:
Click the Run MackChainLadder button to apply the method.
c) Generalized Linear Model
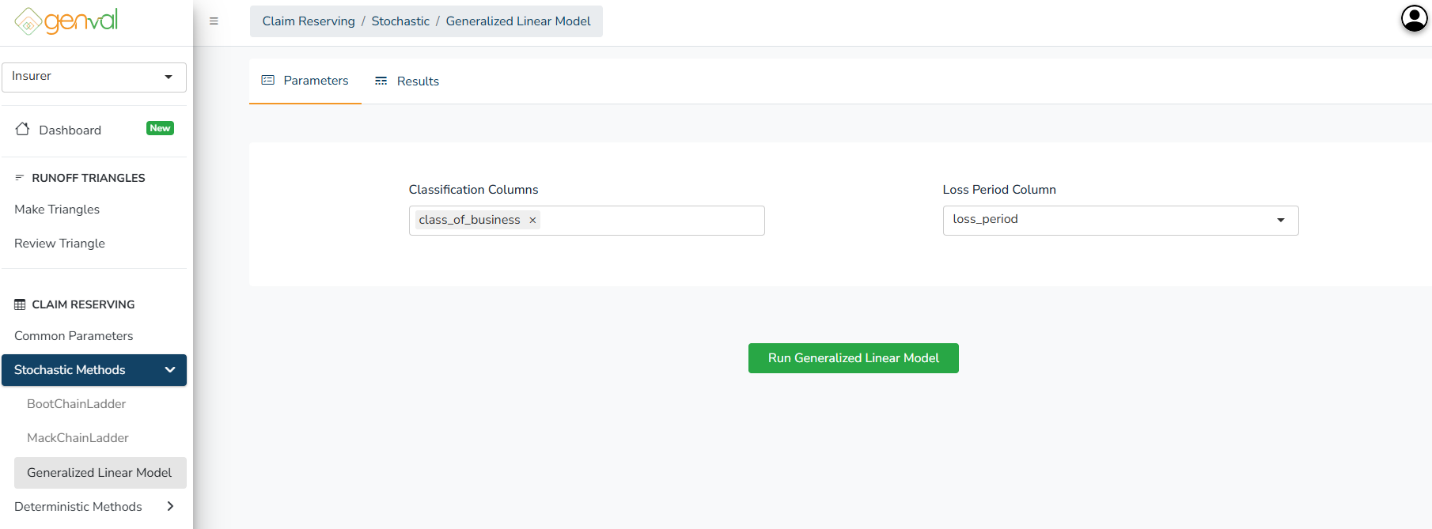
This method does not require any extra parameter inputs other that the classification columns and loss period column.
Click the Run Generalized Linear Model button to apply the method.
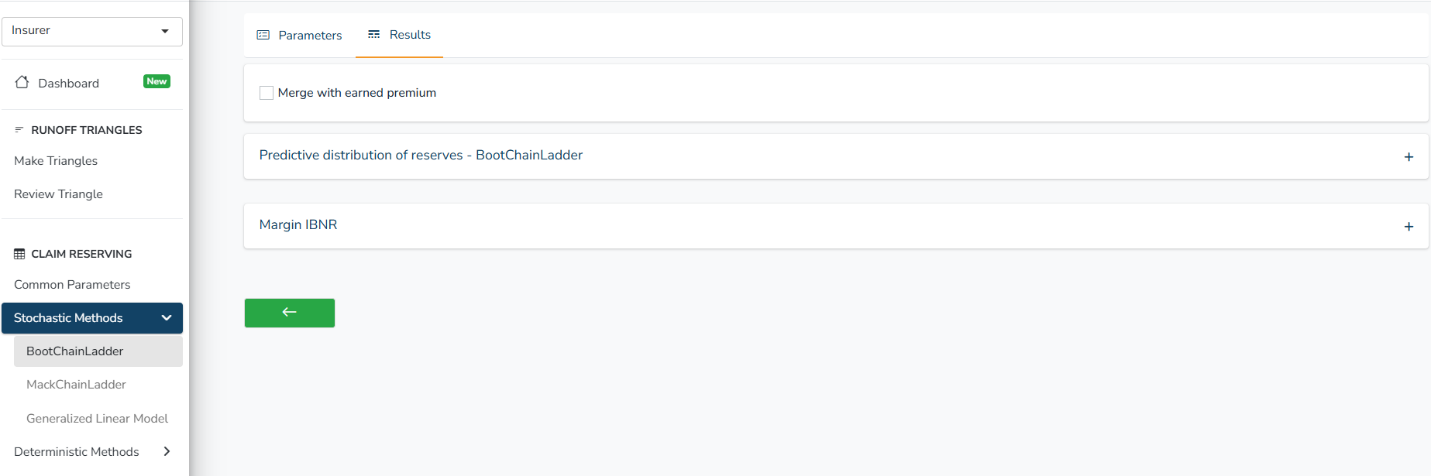
Every successful stochastic run will redirect you to the results table, with both Predictive distribution of reserves and margin IBNR.
If you already generated/uploaded earned premium, you can check the Merge with Earned Premium box. This combines outstanding loss reserves with earned premium.
Expand the tables (click + to expand) and download when needed.
Deterministic Methods
When you Proceed to Deterministic Methods, you will be directed to Basic ChainLadder, the first under the deterministic methods sidebar. You can select any of the methods that you want to use (Bornhuetter-Ferguson (BF), Cape Cod, Expected Loss Ratio or Average Cost)
a) Basic ChainLadder
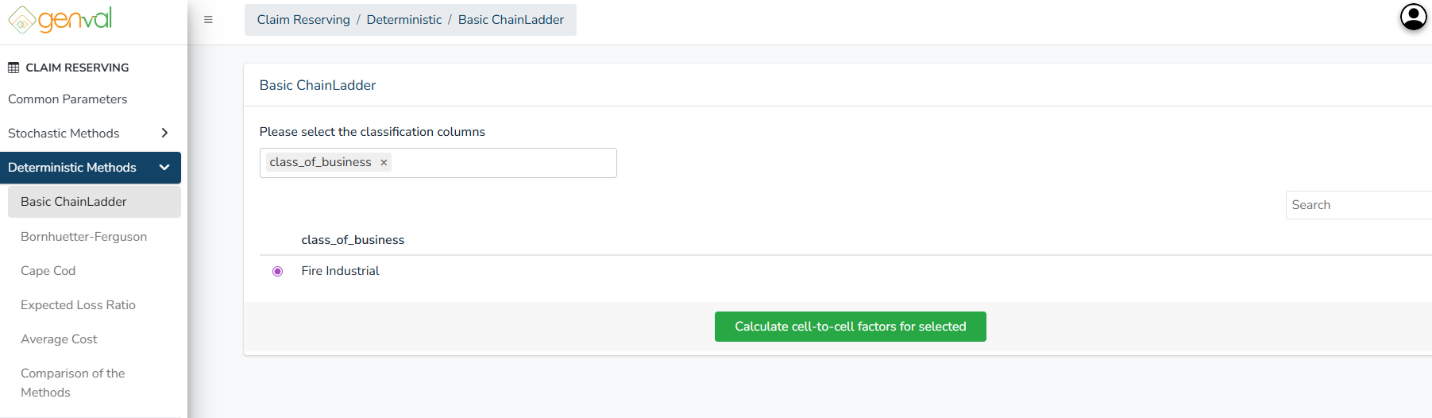
Select the classification columns and chose a class for which you want to calculate the ultimate claims (Each classification will generate a separate reserve calculation).
Click the Calculate cell-to-cell factors for selected button to generate the factors. You will see the cell-to-cell factors table:
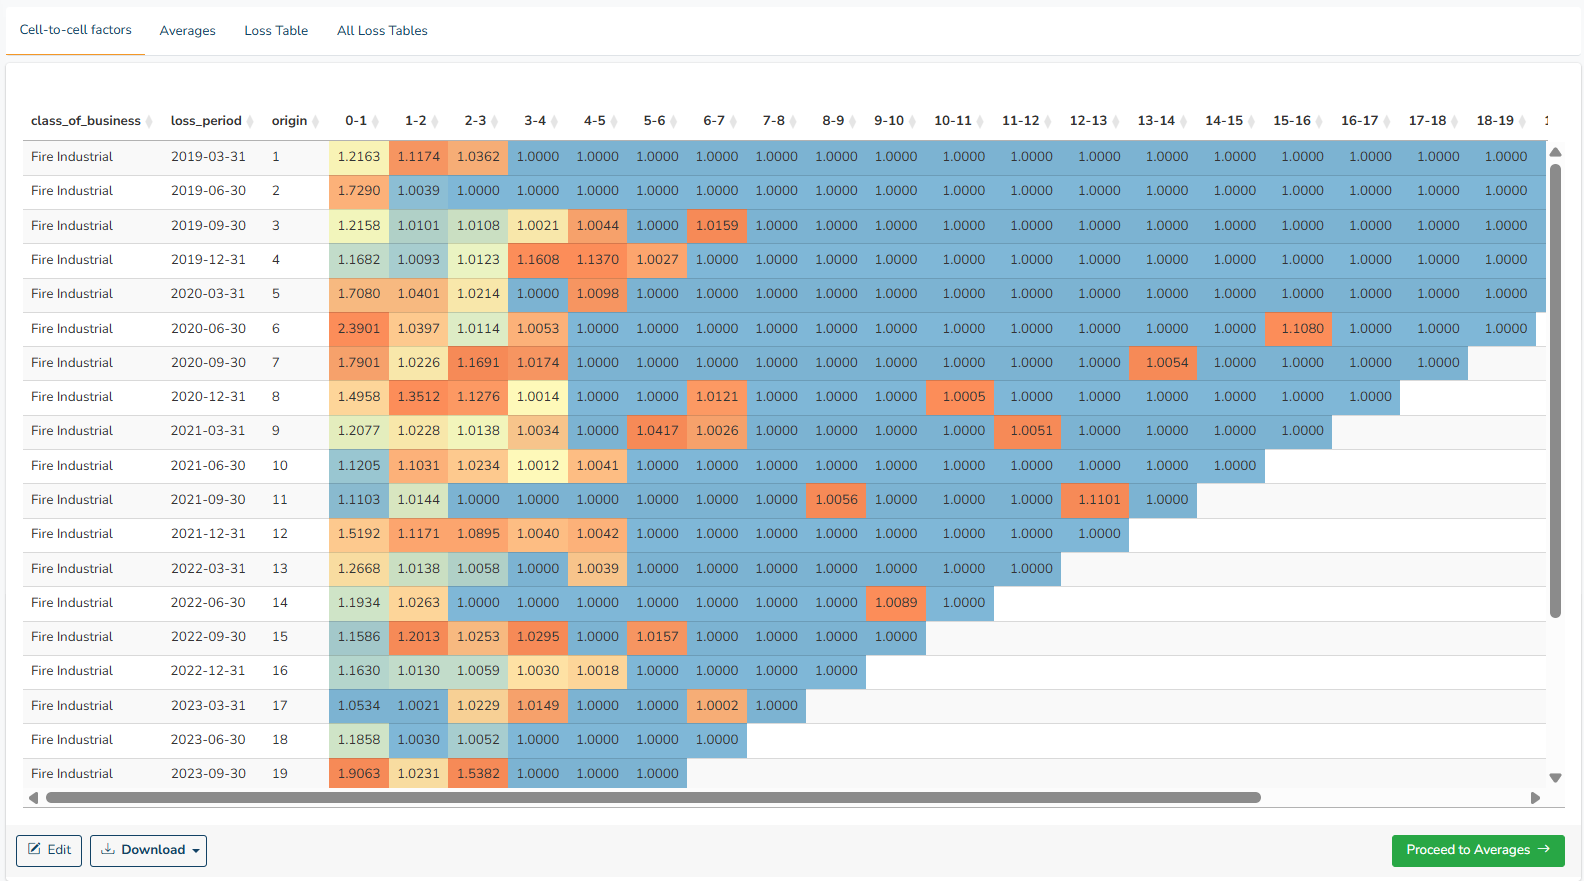
You can edit or download the cell-to-cell factors before continuing. You then click the Proceed to Averages button. You’ll be directed to the Averages tab where you review, edit, select, and refine development factors used to project future claims.
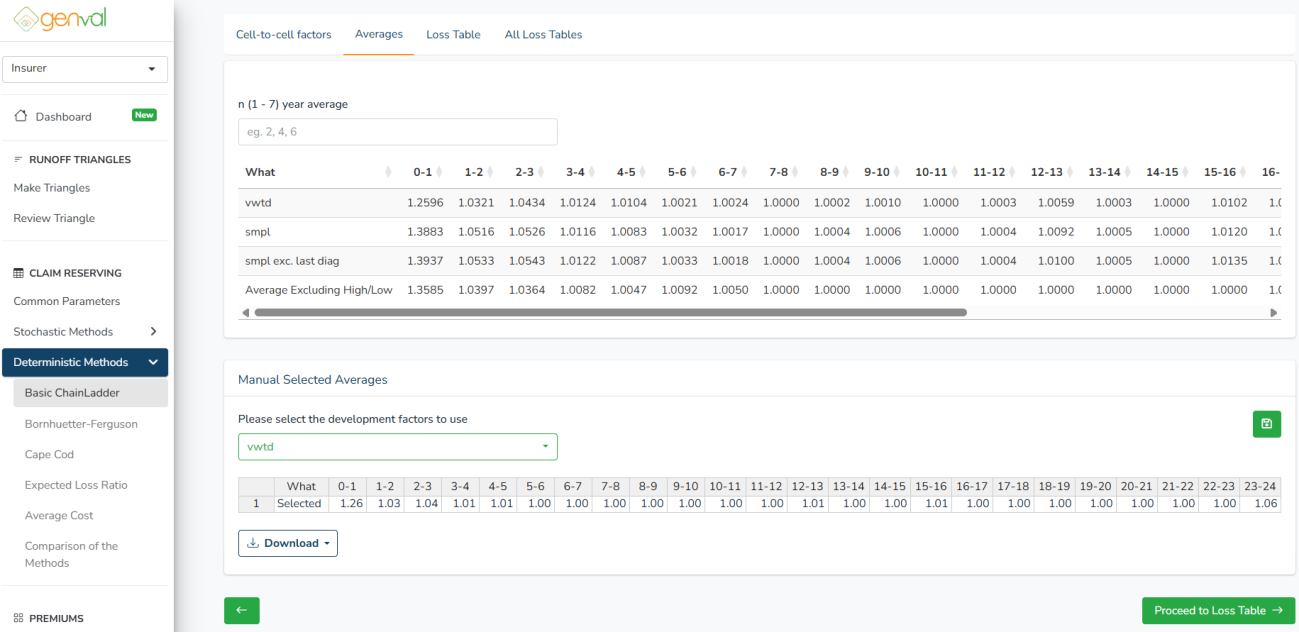
n ({min} – {max}) year average – Select how many of the most recent diagonals to use. Valid values range from {min} to {max}, depending on the uploaded data.
{min} = smallest allowable number of diagonals based on data
{max} = largest allowable number of diagonals based on data
Please select the development factors to use – four options:
- vwtd - Volume-weighted average each diagonal weighed by cumulative claims
- smpl - Simple average, treating all diagonals equally.
- smpl exc. last diag - Simple average excluding the latest diagonal
- Average Excluding High/Low - Removes the highest and lowest factor per column before averaging
You can EDIT the manual selected averages by clicking into the cells and changing the values.
Here, you can SAVE the development factors to the project (if project was loaded at the dashboard). Click the green folder icon to save the used averages.
You then click the Proceed to Loss Table button. You can also access it by selecting the loss table tab.
The loss table shows the ultimate claims and IBNR specific for the selected class chosen before calculating cell-to-cell factors.
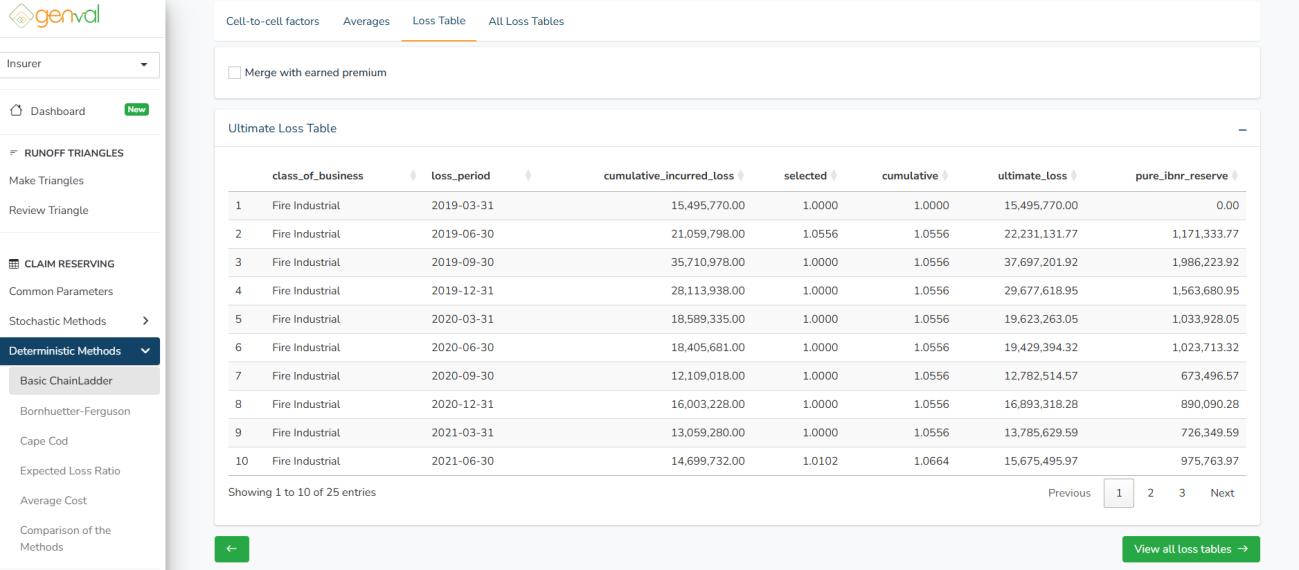
If you already generated/uploaded earned premium, you can check the Merge with Earned Premium box. This combines outstanding claim reserves with earned premium.
If you have different classes in the classification columns, select one class at a time, and repeat the same process from calculating cell-to-cell factors, selecting averages, and loss table calculation.
Click the View all loss tables button to view and download the final results where all the classes for which you have performed the basic chainladder are combined. Click the download button to download either a csv or xlsx results file.
b) Bornhuetter-Ferguson (BF) Method
This method requires both the paid and reported triangles (refer to triangle generation) and also the Earned Premium file (either uploaded or generated).
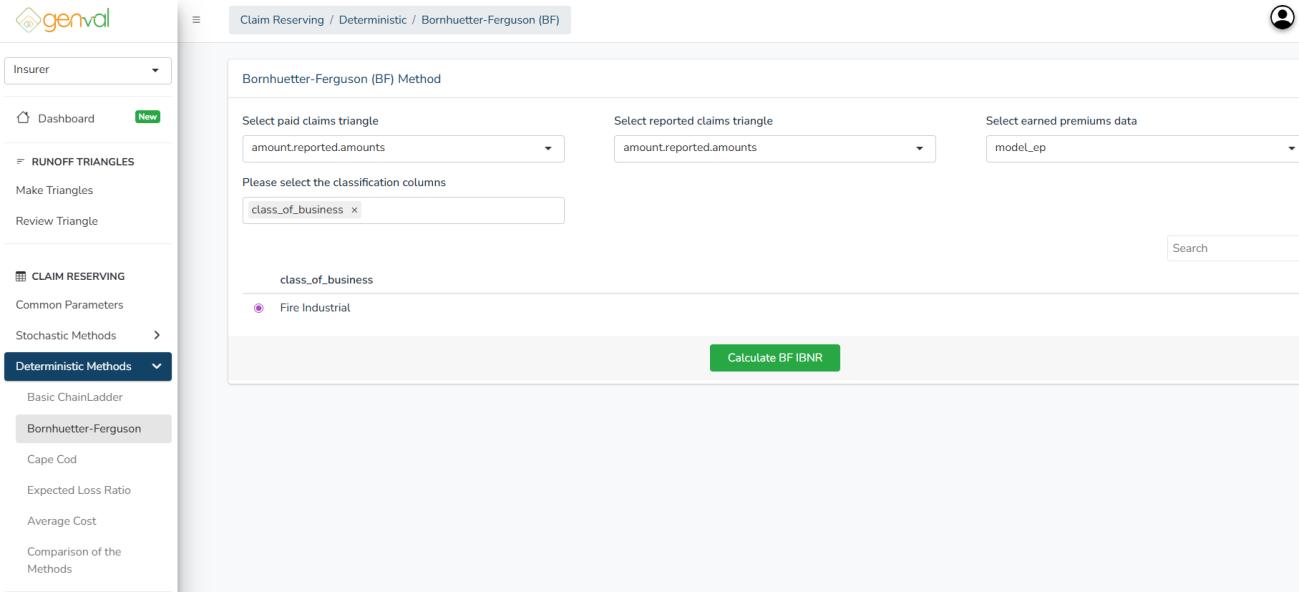
Select Paid Claims Triangle – Choose the data triangle that represents cumulative paid claims over time.
Select Reported Claims Triangle – Choose the triangle containing cumulative reported claims amounts.
Select Earned Premiums Data – Specify the dataset containing earned premium figures.
Classification Columns – Defines how the data should be grouped, such as by class of business or other categorical fields. Each classification will generate a separate BF reserve calculation.
After specifying the classification column, select the particular class (e.g., Fire Industrial) to perform the Bornhuetter-Ferguson (BF) IBNR calculation for that segment.
Finally, click Calculate BF IBNR to generate reserve estimates based on the selected triangles and earned premium data.
You’ll be directed to the Averages tab where you review, edit, select, and refine development factors used to project future claims.
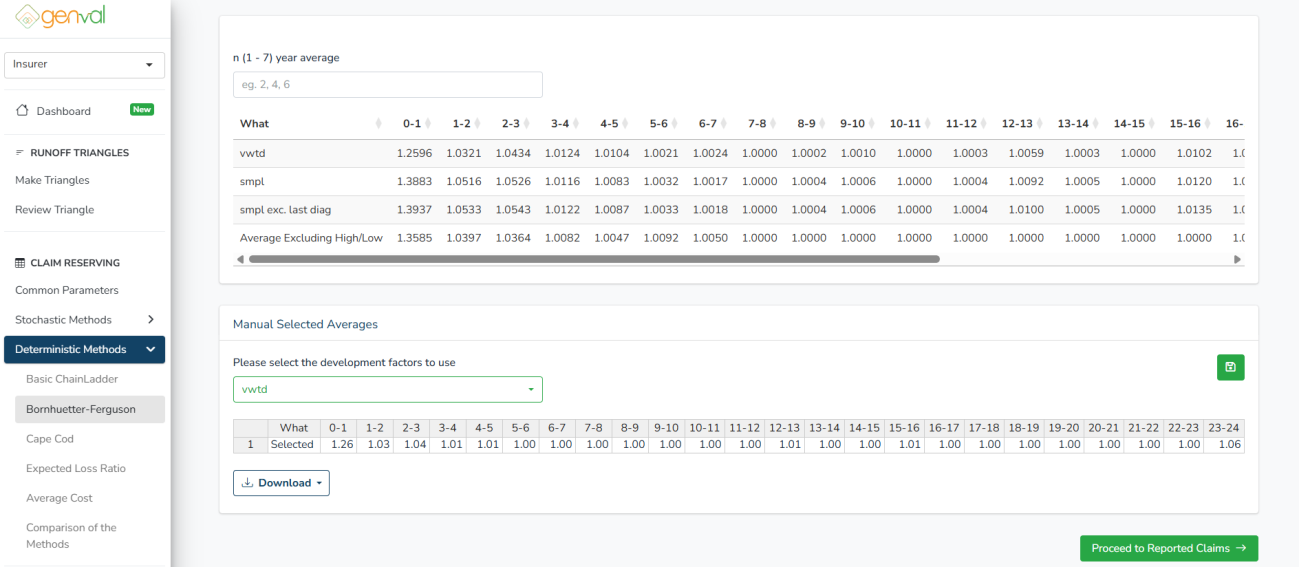
n ({min} – {max}) year average – Select how many of the most recent diagonals to use. Valid values range from {min} to {max}, depending on the uploaded data.
Please select the development factors to use – four options:
- vwtd - Volume-weighted average each diagonal weighed by cumulative claims
- smpl - Simple average, treating all diagonals equally.
- smpl exc. last diag - Simple average excluding the latest diagonal
- Average Excluding High/Low - Removes the highest and lowest factor per column before averaging
You can EDIT the manual selected averages by clicking into the cells and changing the values.
Here, you can SAVE the development factors to the project (if project was loaded at the dashboard). Click the green folder icon to save the used averages
Proceed to Reported Claims averages and select the development factors.
Click the Proceed to Earned Premiums button to preview the earned premium. Here, you can also EDIT the loss ratios to use.
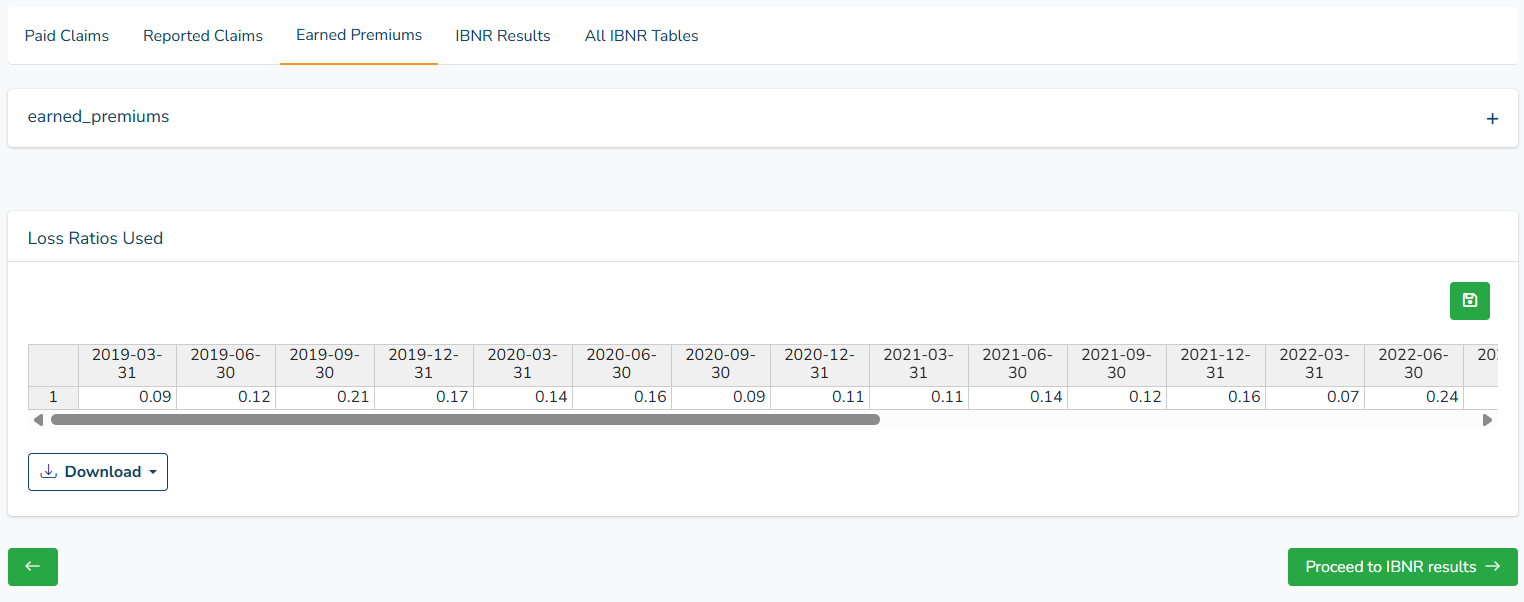
To SAVE the loss ratios used to the project (if project was selected at the dashboard), click the green folder icon to save the used averages.
You then click the Proceed to IBNR results button. You can also access it by selecting the IBNR results tab.
The IBNR results tab shows the IBNR results specific for the selected class chosen before calculating BF IBNR.
Click the Proceed to all Tables results button to view and download the BF method IBNR results where all the classes for which you have performed the calculation are combined. Click the download button to download either a csv or xlsx results file.
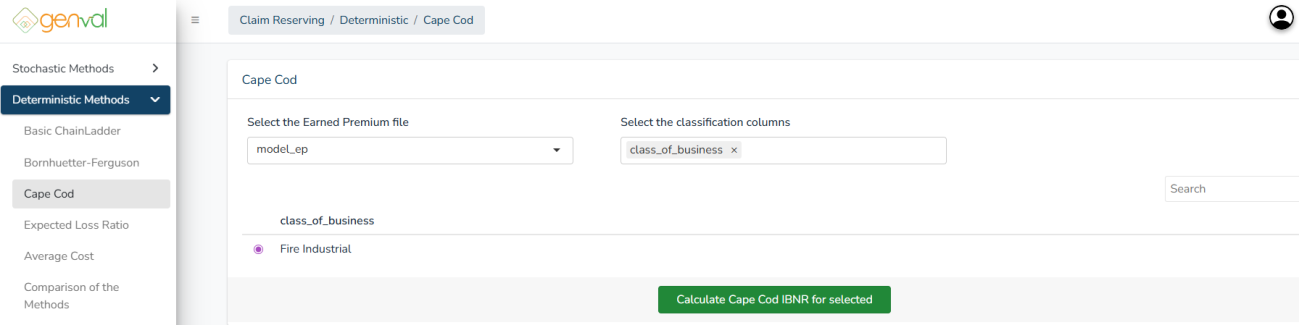
c) Cape Cod Method
Select the Cape Cod method on the sidebar menu. You will be needed to select the earned premium file and the classification column.
After selecting the inputs, select the particular class (e.g., Fire Industrial) to perform the Cape Cod IBNR calculation for that segment.
Finally, click Calculate Cape Cod IBNR for selected
You’ll be directed to the Averages tab where you review, edit, select, and refine development factors used to project future claims.
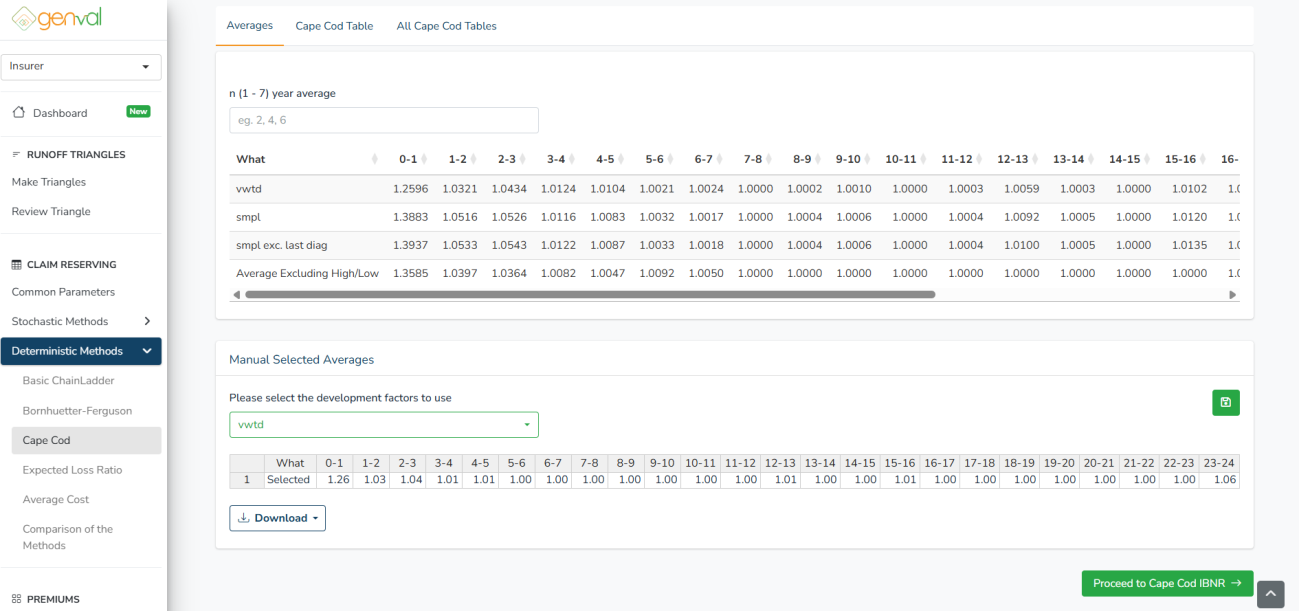
n ({min} – {max}) year average – Select how many of the most recent diagonals to use. Valid values range from {min} to {max}, depending on the uploaded data.
Please select the development factors to use – four options:
- vwtd - Volume-weighted average each diagonal weighed by cumulative claims
- smpl - Simple average, treating all diagonals equally.
- smpl exc. last diag - Simple average excluding the latest diagonal
- Average Excluding High/Low - Removes the highest and lowest factor per column before averaging
You can EDIT the manual selected averages by clicking into the cells and changing the values.
Here, you can SAVE the development factors to the project (if project was loaded at the dashboard). Click the green folder icon to save the used averages.
You then click the Proceed Cape Cod IBNR button. You can also access it by selecting the Cape Cod table tab.
The IBNR results tab shows the Cape Cod IBNR results specific for the selected class chosen before calculating Cape Cod IBNR.
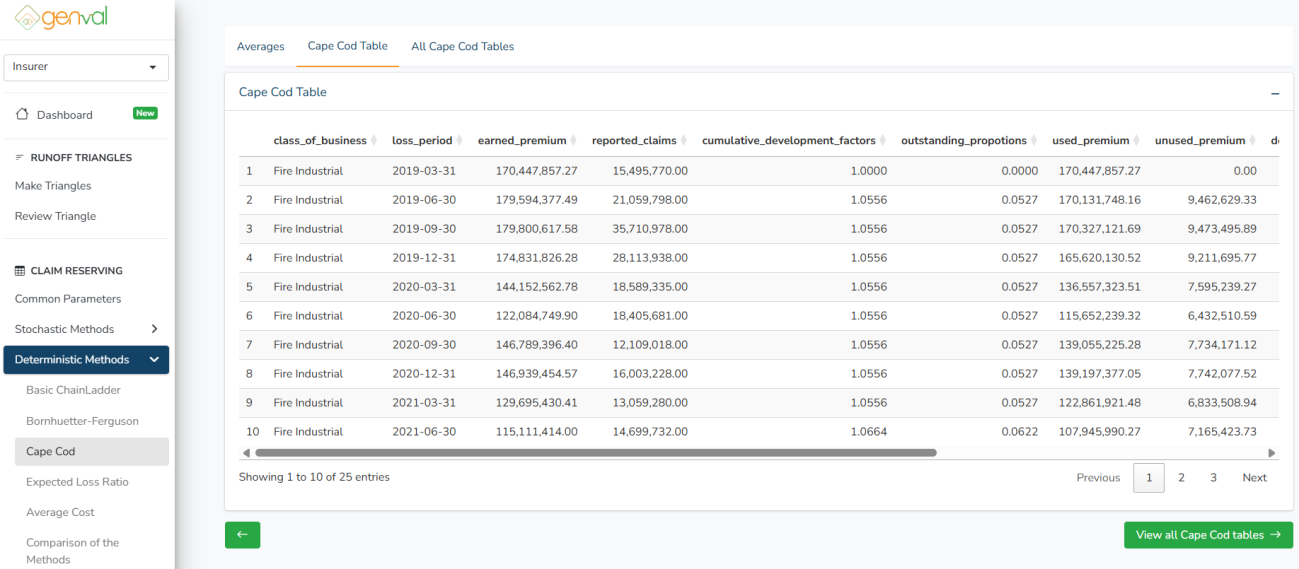
Click the View all Cape Cod tables button to view and download the Cape Cod method IBNR results where all the classes for which you have performed the calculation are combined. Click the download button to download either a csv or xlsx results file.
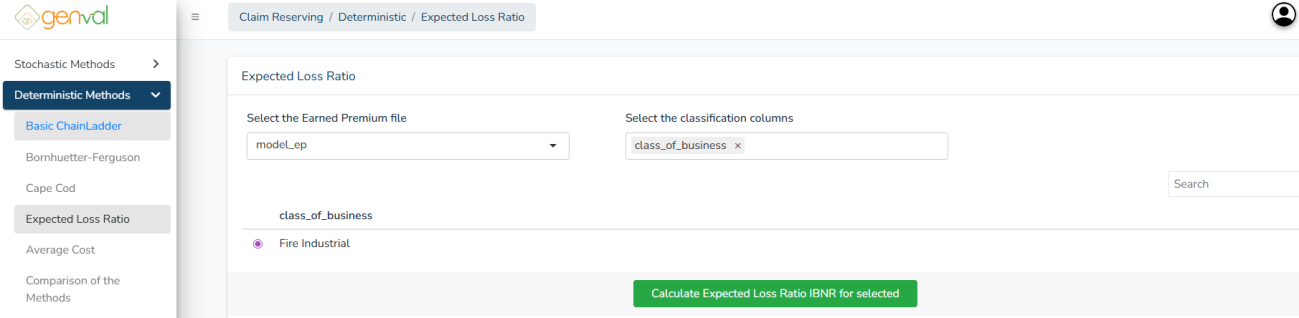
d) Expected Loss Ratio
Select the Expected Loss Ratio method on the sidebar menu. You will be needed to select the earned premium file and the classification column.
After entering the inputs, select the particular class (e.g., Fire Industrial) to perform the Expected Loss Ratio IBNR calculation for that segment.
Finally, click Calculate Expected Loss Ratio IBNR for selected
You’ll be directed to the Expected Loss Table tab where you manually enter the loss ratios into the 'loss_ratio_assumption' column.
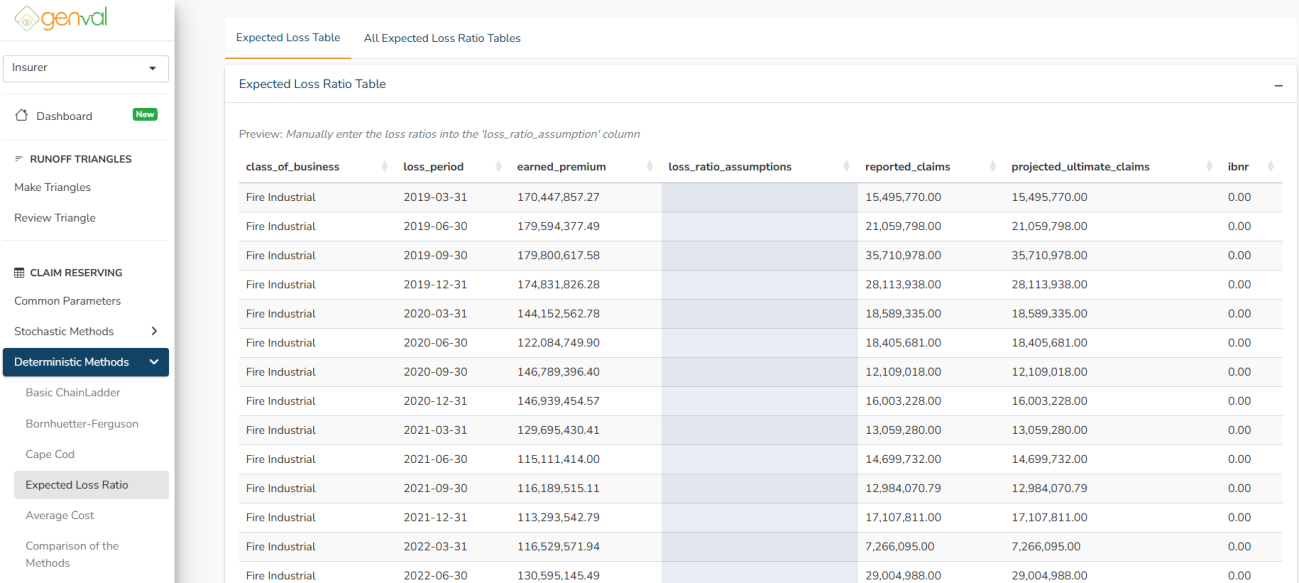
Double-click into the cell in the loss_ratio_assumption column and enter numeric values as percentage (eg. 0.2 for 20%). The IBNR cells will automatically update as you enter the loss ratio values.
Here, you can SAVE the loss ratios used to the project (if project was loaded at the dashboard). Click the green folder icon to save the used ratios.
Repeat the process for all the classes for which you want to calculate the IBNR.
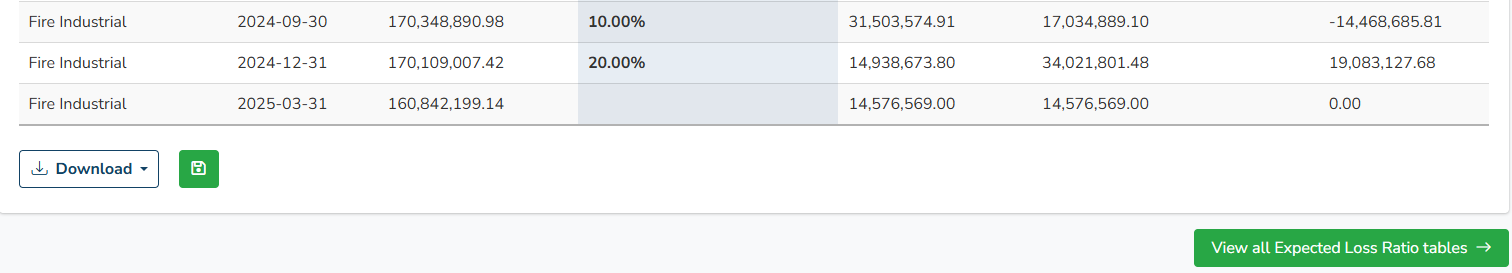
Finally, click the View all Expected Loss Ratio tables button to view and download the Expected Loss Ratio method IBNR results where all the classes for which you have performed the calculation are combined. Click the download button to download either a csv or xlsx results file.
e) Average Cost Method
Select the Average Cost method on the sidebar menu. You will be needed to select the number of unique claims triangle and the classification column.
After entering the inputs, select the particular class (e.g., Fire Industrial) to perform the Average Cost Method IBNR calculation for that segment.
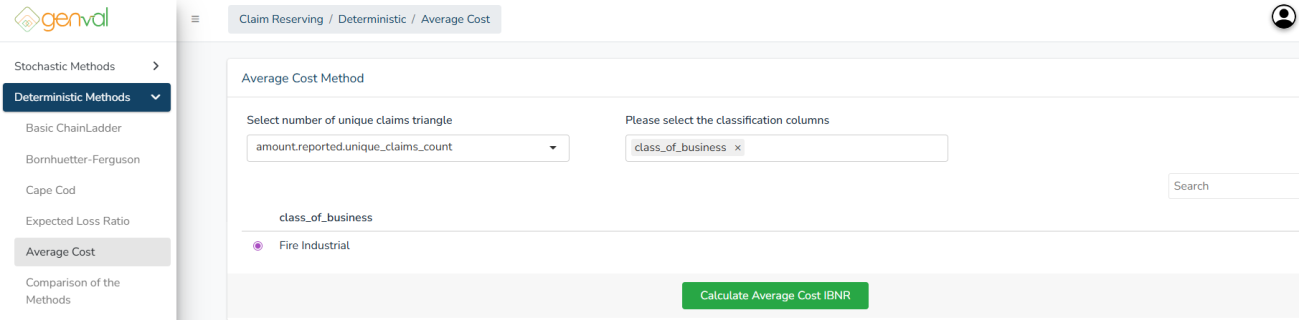
Next, click Calculate Average Cost IBNR
You’ll be directed to the Cumulative Unique Claims tab where you review, edit, select, and refine development factors used from the unique counts triangle.
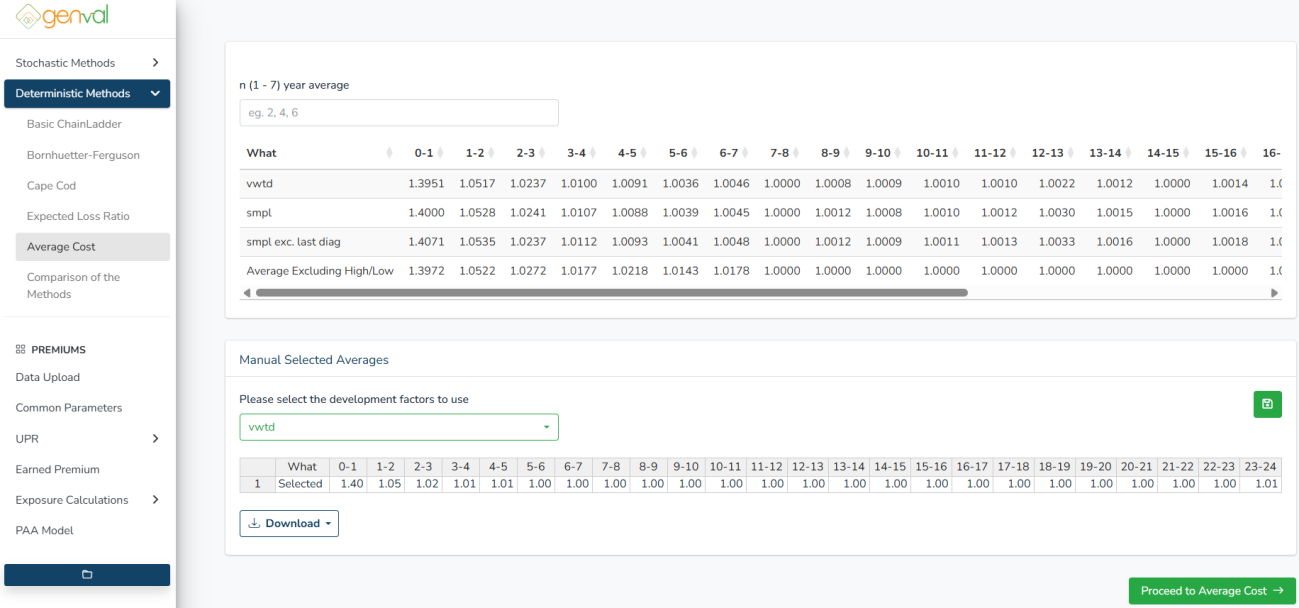
n ({min} – {max}) year average – Select how many of the most recent diagonals to use. Valid values range from {min} to {max}, depending on the uploaded data.
Please select the development factors to use – four options:
- vwtd - Volume-weighted average each diagonal weighed by cumulative claims
- smpl - Simple average, treating all diagonals equally.
- smpl exc. last diag - Simple average excluding the latest diagonal
- Average Excluding High/Low - Removes the highest and lowest factor per column before averaging
You can EDIT the manual selected averages by clicking into the cells and changing the values.
Here, you can SAVE the development factors to the project (if project was loaded at the dashboard). Click the green folder icon to save the used averages.
Proceed to Average Cost averages and select the development factors.
You then click the Proceed to IBNR results button. You can also access it by selecting the IBNR Results tab.
The IBNR results tab shows the Average Cost IBNR results specific for the selected class chosen before calculating Average Cost IBNR.
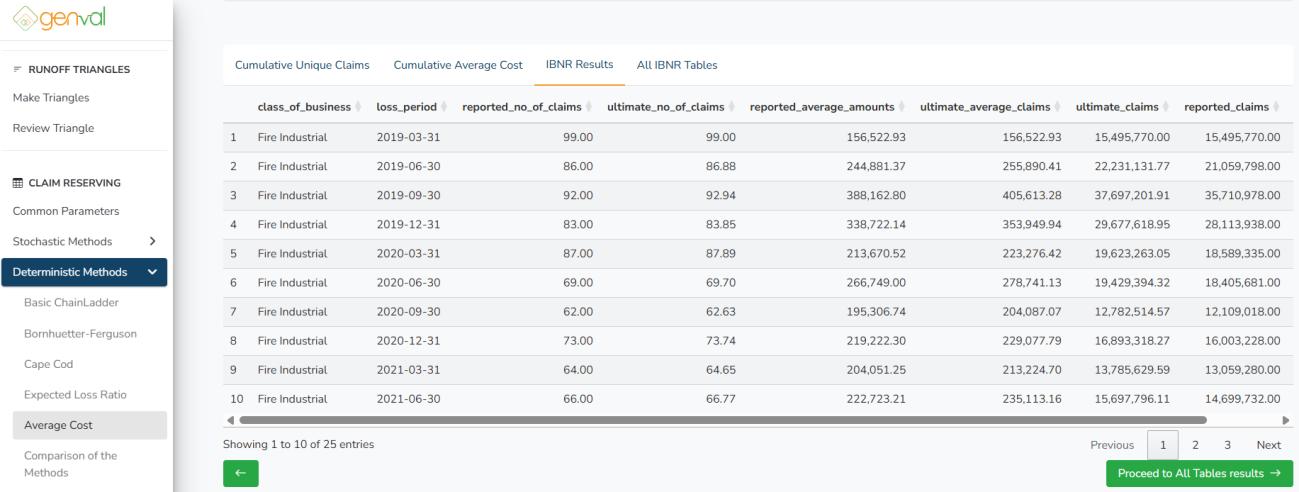
Repeat the process for all the classes for which you want to calculate the IBNR.
Finally, click the Proceed to All Tables results button to view and download the Average Cost method IBNR results where all the classes for which you have performed the calculation are combined. Click the download button to download either a csv or xlsx results file.
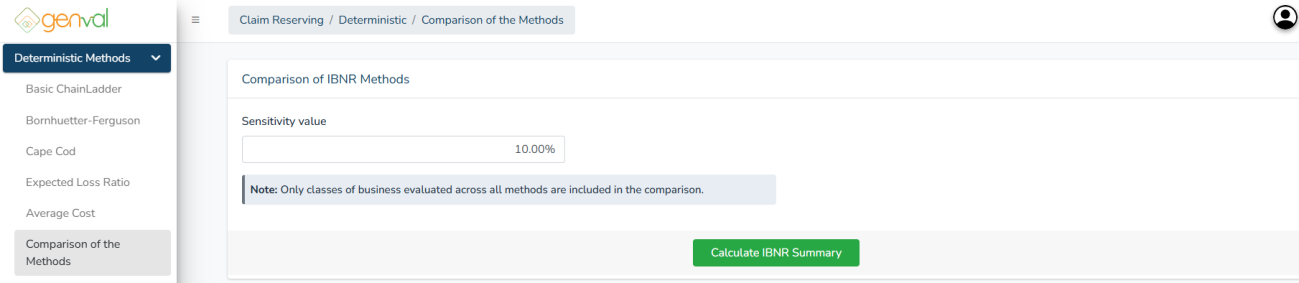
f) Comparison of the Methods
Select the Average Cost method on the sidebar menu. You will be needed to enter the sensitivity value for comparison.
NOTE: Only classes of business evaluated across all methods are included in the comparison.
Edit the sensitivity value as needed and click the Calculate IBNR Summary button
You’ll be directed to the combined results table where you can also view yearly summarized results and sensitivity results.
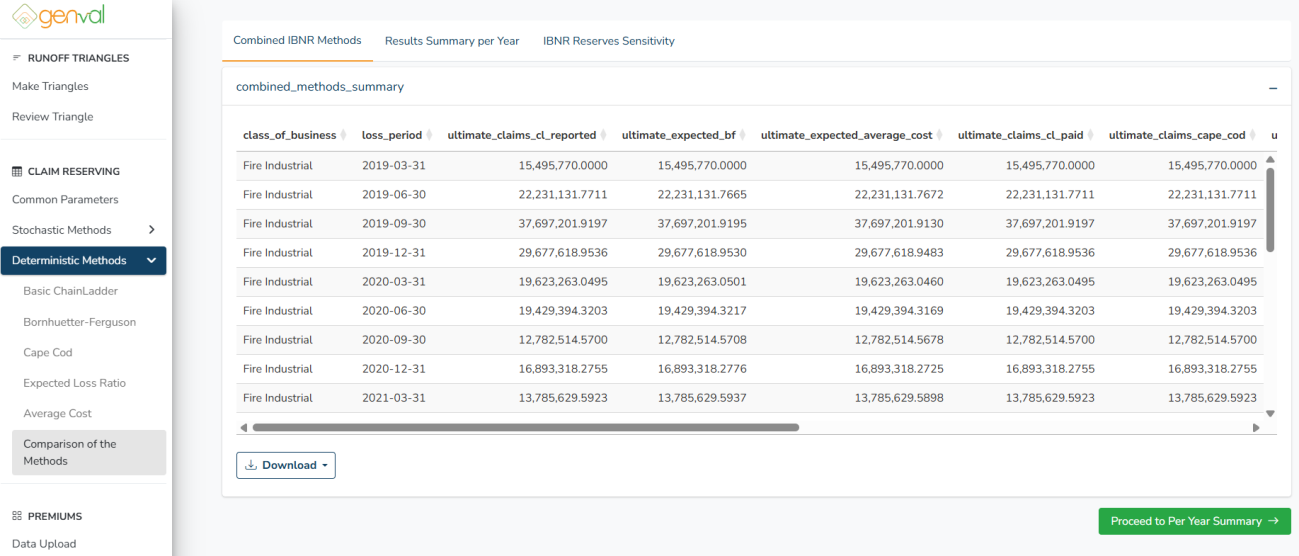
You can download the combined results at this point by clicking the Download button.